Stream Analytics is used to examine high volumes of data streaming from devices or processes, extract information from that data stream, identify patterns, trends, and relationships. Those patterns can trigger other processes or actions, like alerts, automation workflows, feed information to a reporting tool, or store it for later investigation (check Stream Analytics Introduction article for more details).

See previous: Part 2: Creating an alert using Service Bus and Logic Apps
Configuring Stream Analytics

So far we’ve learned how to connect our device(s) to IoT Hub, read real-time data and trigger actions based on alerts. It’s time to understand how to send data to Stream Analytics and what is possible to do from there.
The first step is to input the data from our device(s) into Stream Analytics. Then we’ll build and call a machine learning web-service using the output of a prepared weather prediction model, built upon historic data to forecast chance of rain based on temperature and humidity data. The last step is to output this into a storage blob and later on PowerBI.
There are four items that composes the Stream Analytics topology:
- Input: Used to define the source for your data to be captured (Event Hub, IoT Hub or Blob storage)*.
- Output: Used to define where your data will be delivered (Event Hub, SQL Database, Blob storage, Table storage, Service Bus Topic, Service Bus Queue, Cosmos DB, Power BI, Data Lake Store or Azure Function)*.
- Query: Expressed in a SQL-like query language, it’s used to filter your input data, data transformation, aggregations, calculations, external functions call, output the data and many other options. Check “Query examples for common Stream Analytics usage patterns” for reference.
- Functions: Used as part of the stream analytics queries, they can be used to perform complex calculations or take advantage of machine learning solutions, supporting currently Javascript UDF (User-Defined Functions), Javascript UDA (User-Defined Aggregates) and Azure Machine Learning.
* Current Input and Output options available on March/2018, subject to change at any time by Microsoft.
Follow the complete steps on “Weather forecast using the sensor data from your IoT hub in Azure Machine Learning“.
I’ve changed the Query in the Microsoft’s article for this one. The results are basically the same, but this is a bit easier to read:
WITH DevKitMachineLearning AS (
  SELECT
    deviceid,
    EventEnqueuedUtcTime,
    temperature,
    humidity,
    [devkit-function-ml](temperature, humidity) AS result
  FROM [your-input-alias]
)

SELECT
  DeviceId AS Device,
  System.Timestamp AS Time,
  CAST (result.[temperature] AS FLOAT) AS Temperature,
  CAST (result.[humidity] AS FLOAT) AS Humidity,
  CAST (result.[Scored Probabilities] AS FLOAT) * 100 AS 'Chance of Precipitation'
INTO [your-output-alias]
FROM DevKitMachineLearning
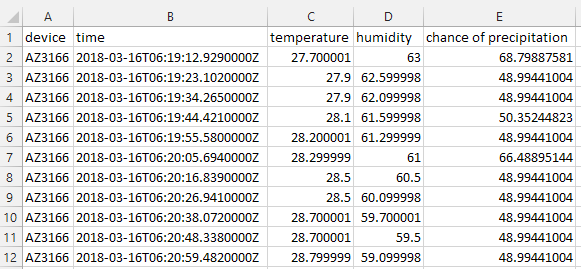
From here you’ll have all the data – the source from your devices and the results from the machine learning service – output to a CSV file saved on a storage blob, that will looks like this:

2 thoughts on “Part 3: Using Machine Learning to calculate chance of precipitation and saving the output”