
We all know… it’s rarely a good idea to allow direct calls from the front-end system (e.g. an e-commerce website) to the back-end (ERP). But in some situations we have to expose the OData endpoints for either internal or external consumers.
Like when you integrate the ERP with a warehouse management system, where the communication can be quite chatty with peaks during certain periods.
Or business users thinking it’s a good idea to upload a journal with 10k+ lines via Excel plugin, or refresh that awesome PowerBI report every 10 minutes, sucking your entities to the bone.
So, how much load OData can take?
The answer for that question isn’t straight forward, but having some high level metrics is important to help you plan and design accordingly, so, I’ve decided to run a quick test using Artillery.io tool. As describe in their website:

“Artillery is a modern, powerful & easy-to-use load testing and functional testing toolkit. Use it to ship scalable applications that stay performant & resilient under high load.”
It’s a free tool written in Node.Js (you don’t need to know Node to use it). There’s a Pro version, but you don’t need for this particular test. The whole installation and execution process is quite simple and quick, just follow the Getting Started With Artillery instructions.
And hey, why not star their GitHub project as well? Or maybe contribute if you’re a Node.Js type of guy.
The environments
I’m running Artillery in a Surface Pro laptop (I know, I know…) with a Core i5. That’s an important variable as Artillery monitors the CPU usage and complains when it exceeds 80%, which may cause performance degradation, impacting your tests and generating inaccurate results.
My target system is a D365 FinOps Tier 3 environment, same region as me (straya east, mate!). No users logged, no background process running, no integrations.
I’m in a not-so-fast decent connection (90+ Mbps download, 35+ Mbps upload), stable 5Ghz wifi, enough to not be the bottleneck or compromise my requests.
The goal isn’t to measure the network latency between my laptop and the VM, but to understand what’s the impact of multiple parallel requests (virtual users) via OData endpoints, simulating a high-load peak situation.
Test Scenarios
Although it’s possible to execute requests via a single command line, we need to use a YAML script to specify some details – including header authentication.
As you probably know at this point (if not – check the Artillery getting started documentation), we can set the test duration (seconds) and the arrival rate – that means how many virtual users (VU) will arrive per second.
We also specify the target resource, method (GET/POST) and URL.
For this test, I’m requesting a random vendor information from Vendors V2 entity – you can use any other entity you want, just keep in mind the response time will vary depending of which entity you choose. I’m using the same entity across the test cases and increasing the number of VUs, so I can understand the variances in the same context.
Setting to generate 100 VUs per second during 30 seconds, the YAML script should looks like this:
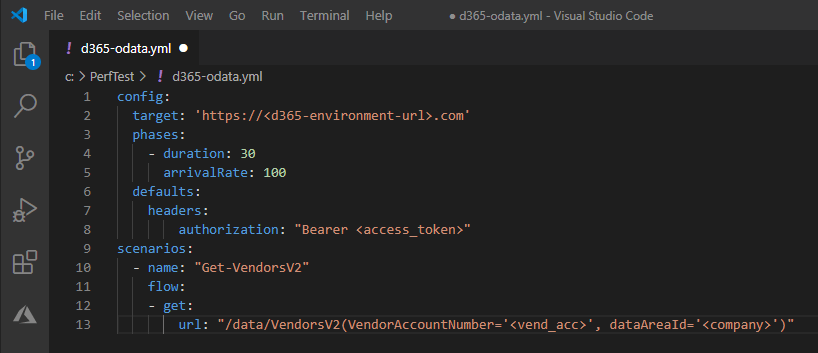
Note that each virtual user creates a new TCP connection. 100 VU per second means 100 new TCP connections per second. Be mindful of that when setting your script to avoid high CPU usage.
For further details, please check the Scrip Reference documentation. There are a couple interesting options explained there.
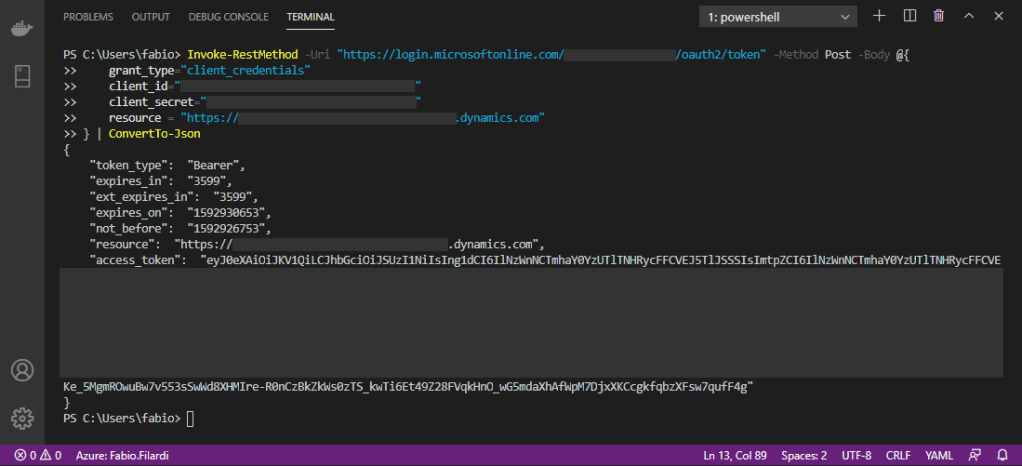
To get the access token just open a Powershell terminal and run the command below (I’m assuming you already have your OData authentication sorted out and have your client id and secret in hands. Otherwise please follow the instructions here):
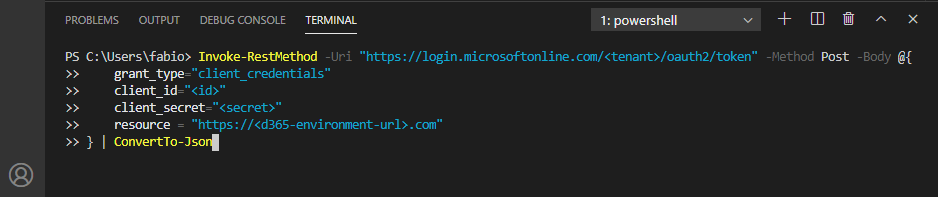
You’ll get back a JSON with the access token. Copy and paste in the YAML script.
And finally, to execute the script, in a command prompt just type:
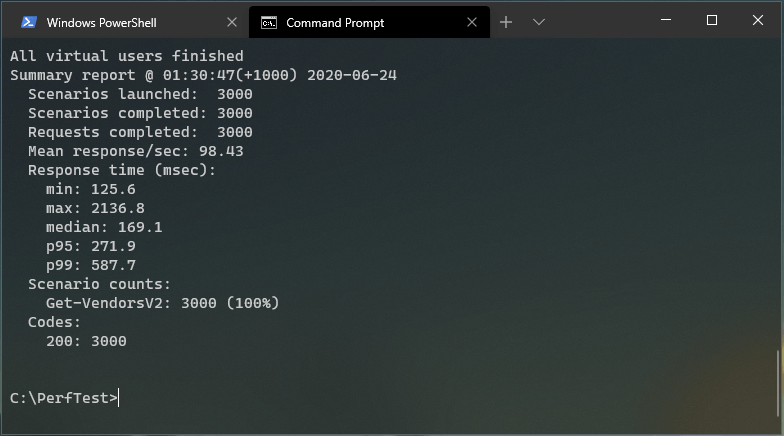
> artillery run your-script.ymlFirst run: 30 seconds, 100 VU/s
With a total of 3000 total requests in 30 seconds, 100% of the requests got 200 (OK) and the avg response time was 169.1 ms. Not bad, but there was some degradation at the end.
Note the p95 and p99 values are respectively the 95th and 99th percentile values.
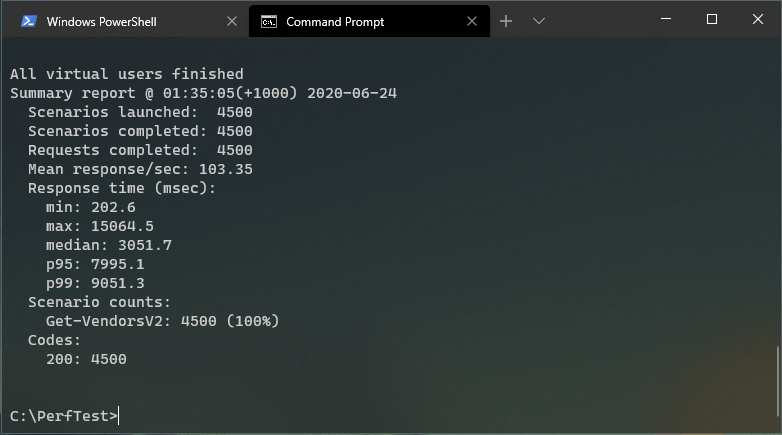
Second run: 30 seconds, 150 VU/s
Now things starts to get a bit ugly. By hitting FinOps with 150 VU/second there’s a far bigger degradation in the response time, even though all 4500 total requests got response code 200 (OK). We’re reaching the limit.
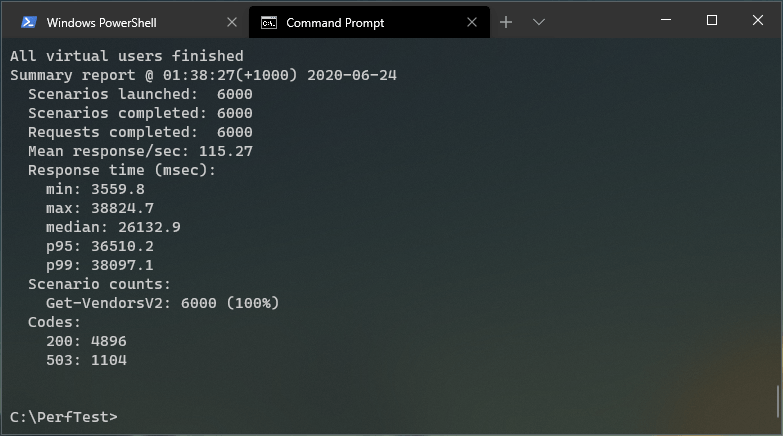
Third run: 30 seconds, 200 VU/s
Now we definitely hit the bottom of the pool. With 200 VU/s the avg response time (26132.9 ms) is quite high, even the minimum is above the acceptable for most scenarios.
Also, out of the 6000 total requests, 1104 got response code 503 (Service Unavailable).
PS: In this run I got a high CPU warning, which may have slightly affected the results.
Conclusion
There are many variables that affects load testing results. Environment sizing, concurrent users, background processes, parallel integrations, custom business logic, and so on.
However, design a resilient and scalable solution requires a good understanding from different perspectives that goes beyond FinOps boundaries.
Next posts I’ll explore some tools that help us address common integration challenges.
