
A common request from cloud & infra operations teams is a centralized place to monitor the environments availability. Lifecycle Services portal already provide a fair amount of metrics… but it’s not that straight forward to get what we want and it’s a different portal. It’s not possible to integrate with Log Analytics and Azure Monitor at all, or feed data into other third-party solutions (like Datadog).
Microsoft is working to enable a seamless integration between Dynamics 365 (FinOps & CE, potentially other products as well) and Azure Application Insights – currently it’s in private preview and data is limited to client-side metrics.
NOTE: This post refers to Dynamics 365 Finance and Operations for reference only. The same solution applies for other Dynamics 365 products, or any web-based application.
While we wait for a more comprehensive solution including server-side data, let’s check how to use the “Availability” feature from App Insights to get a result similar to what we get from load balancers health probes, providing a central place to test you environments and enable the use of custom alerts, dashboards, reports and full integration with external monitoring tools via APIs.
Setting up availability tests
First things first, we need to deploy a new Application Insights using workspace-based mode (to enable full integration with Azure Monitor and Log Analytics). If you don’t know how to do this, check the instruction here.
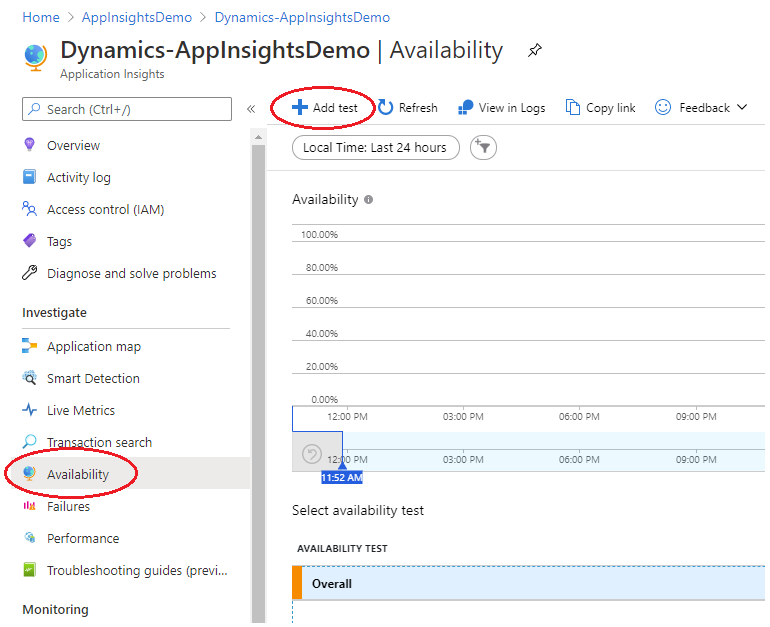
Once it’s created, open “Availability” blade under “Investigate” menu. Click on “+Add test” in top ribbon.
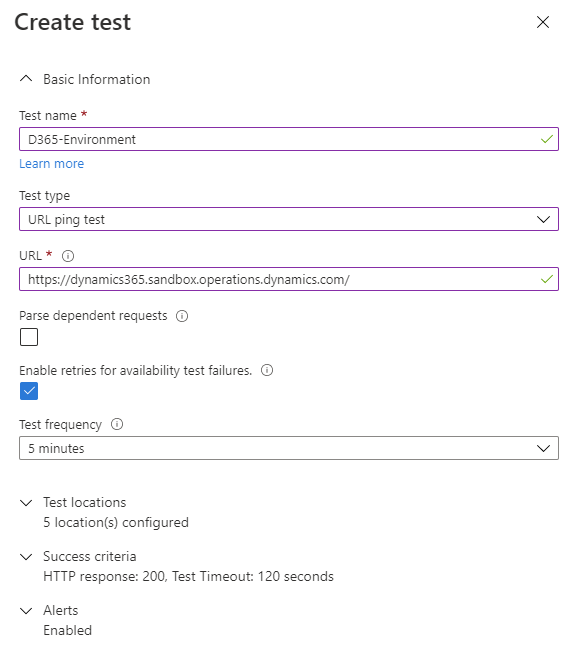
There are just a couple fieldsto fill in:
- Test name: anything you want to use to identify the application/test (in our sample, the environment we’re pointing to);
- Test type: URL ping test is enough, as this is just a health-probe;
- URL: your application address (base FinOps URL, sample provided just as a reference);
- Parse dependent requests: leave it unchecked;
- Enable retries for availability test failures: checked;
- Test frequency: set to 5 (also available for 10 or 15 minutes);
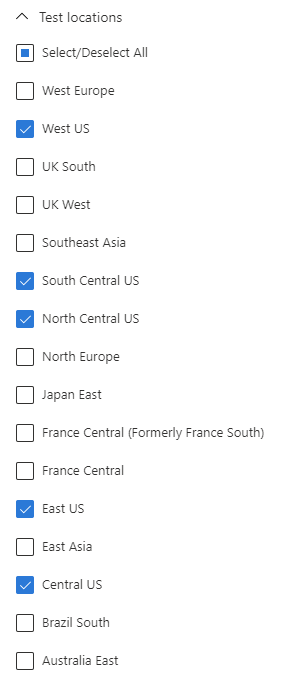
- Test locations: it’s strongly recommended to set at least 3 different locations to avoid false alarms due to transient network issues. In our sample, let’s assume our Production instance is deployed in East US and we want to test the availability and latency from our branch offices across USA. That would like this:
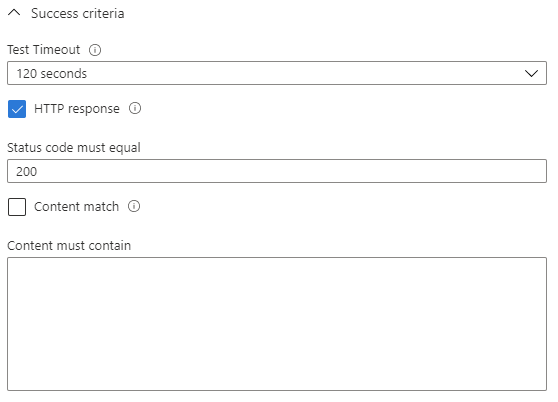
- Success criteria: leave the timeout to 120 seconds and the HTTP response checked, with status code 200 (OK). That’s enough for our demo. For more advanced tests, we can test different status codes and use content match, quite useful when we’re building our own probe endpoint. But that’s out of scope for this post.
And that’s it. First step done.
Configuring alerts
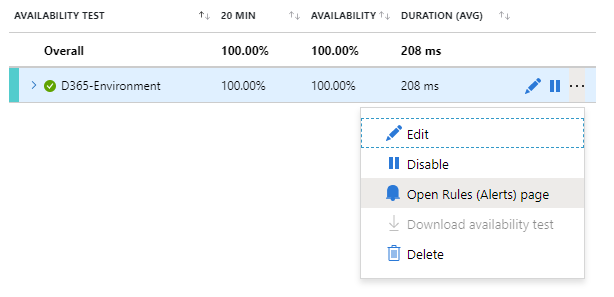
With the test added, we can setup alerts by clicking on the three dots and selecting “Open Rules (Alerts) page“.
For instructions about how to create Alerts on Azure, follow this link. It’s extensive to describe in one post, so, let’s skip it. Microsoft got you covered.
Checking the results
After setting up the test locations and let it running for a while, the main availability dashboard looks like this:
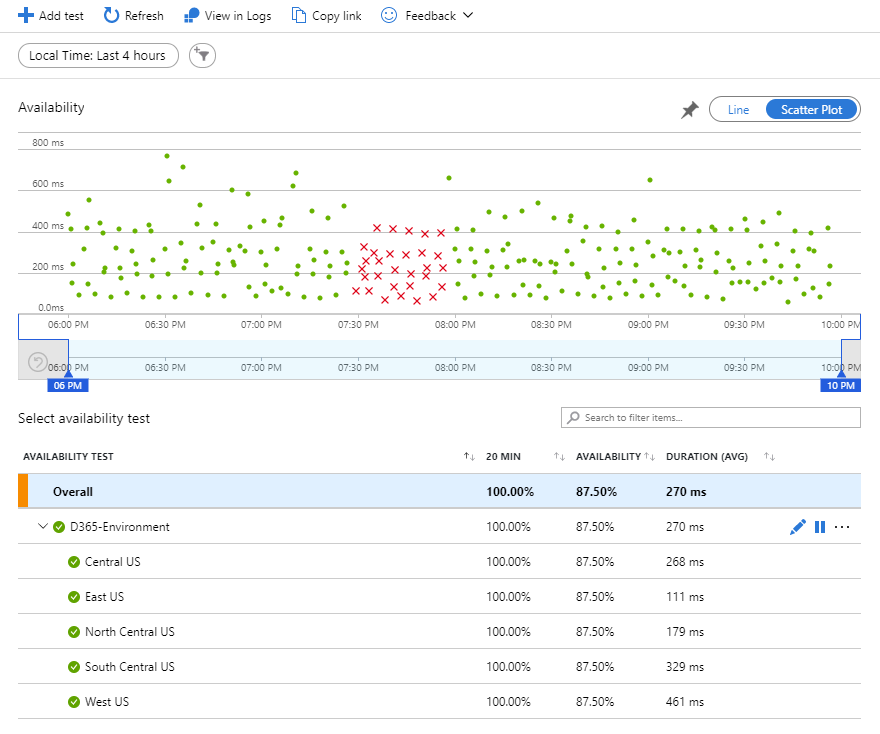
The availability scatter plot at the top shows the results for a given period of time. Notice it shows the green dots as successful access (available) and red crosses as fails (server not available). In the sample, the test server was offline for around half-hour for maintenance between 7:30 PM and 8:00 PM.
The bottom part shows the availability test(s) locations, availability % and average duration for each region.
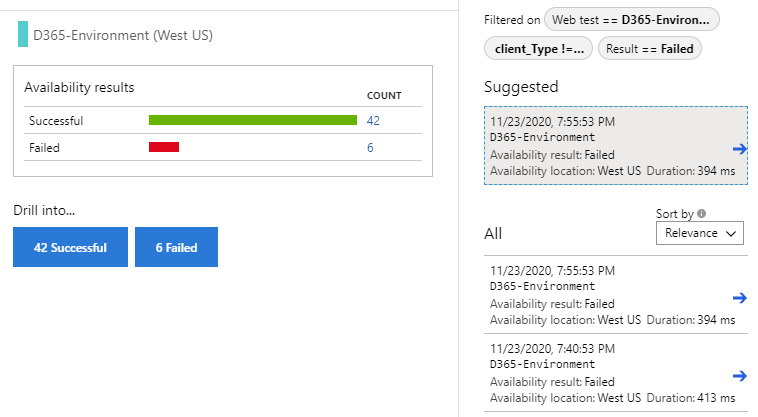
And on the right side you can drill into the successful or failed requests for a given test location:
IMPORTANT NOTE: Please be aware the duration average includes the latency for the AAD token endpoints as well. FinOps is not public and requires authentication.
When drilling into the log entry we can check the latency for each hop:
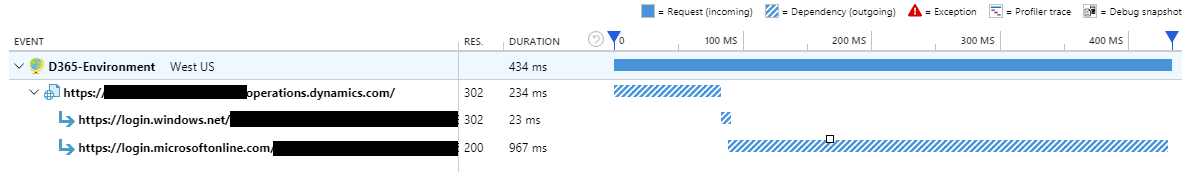
Log – Request details
So, what that means?
Take the results with a grain of salt. If the environment is offline, we’ll get a 502 (Bad gateway) most likely. If the server is online and there’s an issue with the AAD endpoint, you may get a failed request – what is not wrong anyway in terms of availability, as you need to authenticate to get access. And if AAD is down, access to FinOps will be just part of your problem…
That’s pretty acceptable and good enough for most of the cases, specially when we just want to compare the latency across different locations or keep track of environment availability. It’s up to you to decide if that fits your purpose.
Log Analytics
We can play with the saved log metrics using Log Analytics and kusto queries to filter the data and get some interesting charts, like these two basic samples:
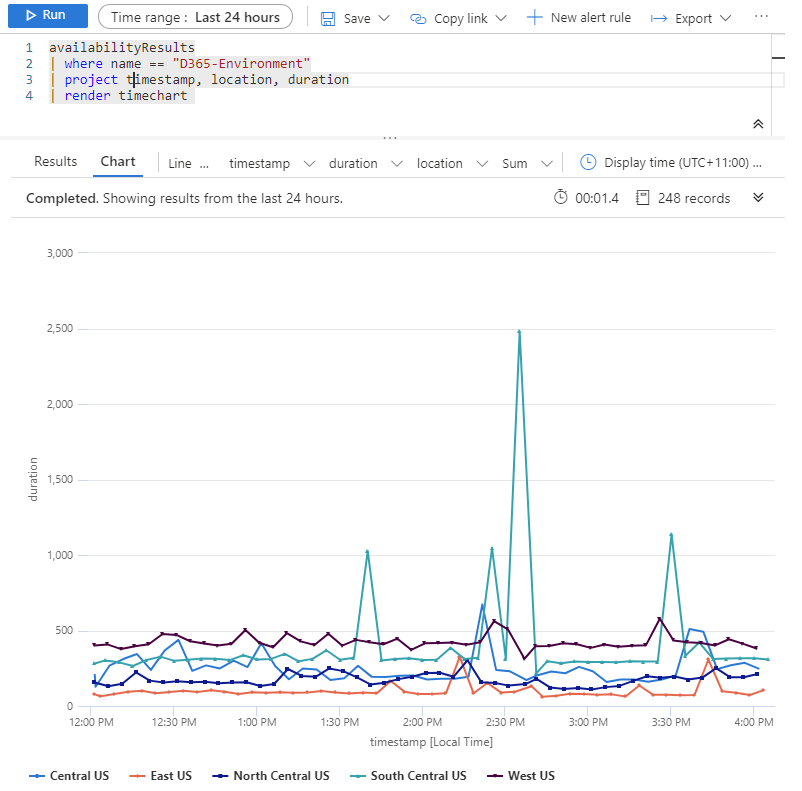
Sample query 1 – Request duration timeline 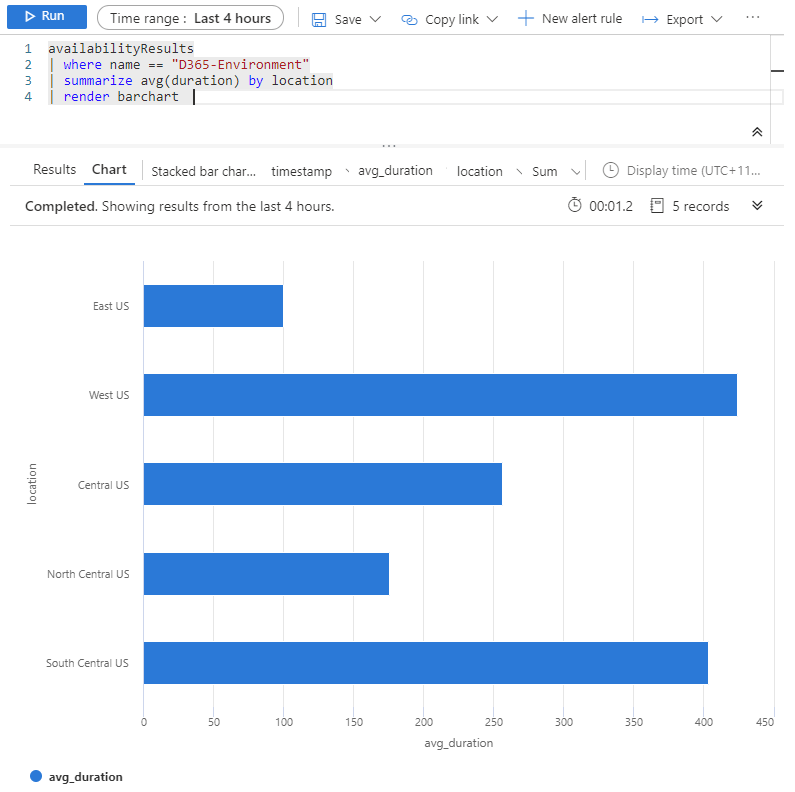
Sample query 2 – Avg request duration per location
To write your queries, open the “Logs” blade, and check the “availabilityResults” table:

App Insights – Log analytics tables
Wrapping up
Availability can be used to monitor prod and/or non-prod environments (cloud-hosted and Microsoft subscription) to generate custom conditional alerts for service disruptions and monthly reports with uptime/downtime, or check the latency deltas across branch-offices accessing from different regions to detect any potential network issues. And many other potential use cases.
Or just feed data to other third-party monitoring solution… More information on how to access log data via APIs:
App insights API
https://dev.applicationinsights.io/documentation/Using-the-API
Log Analytics API
https://docs.microsoft.com/en-us/rest/api/loganalytics/
